
If you have Microsoft 365 or Excel 2021, you already have a PDF importer built in. Power Query (also called Get & Transform) can read tables from PDF files and load them into Excel worksheets. For simple bank statements, this works reasonably well.
This article shows you how to use Power Query to import a PDF bank statement, and when you should reach for a dedicated tool instead.
Step-by-step Power Query workflow
-
Open Power Query. In Excel, go to the Data tab, then Get Data > From File > From PDF.
-
Select your PDF. Navigate to your bank statement PDF and open it. Power Query analyses the file and shows the detected tables in a Navigator pane on the left.
-
Choose a table. Power Query lists every table it found in the PDF. For a bank statement, you want the table that contains the transaction rows. Click each table in the Navigator to preview its contents. Look for a table with columns that resemble Date, Description, and Amount.
-
Transform the data. Click Transform Data to open the Power Query Editor. Here you can:
Remove top rows that contain page headers or account summary information
Promote the first row to column headers if needed
Remove repeated page header rows that appear mid-table
Change data types — set the Date column to Date, and amount columns to Decimal Number
- Load to worksheet. Click Close & Load to write the transformed table to an Excel sheet.
The limitations of Power Query for bank statements
Power Query works well when the PDF contains a clean, regular table with no extraneous content. Real bank statements rarely meet this standard.
Repeated page headers. Multi-page statements typically repeat the column headers and account information at the top of every page. Power Query treats these as data rows. You have to manually filter them out in the Power Query Editor. For a 20-page statement, that is 20 extra rows to clean.
Wrapped descriptions. When a transaction description is too long for one line, it wraps to a second line in the PDF. Power Query sees that second line as a new row, splitting one transaction into two. Fixing this requires merging rows — a non-trivial transformation.
Amount sign ambiguity. Some banks use a single amount column with negative signs for debits. Others use separate debit and credit columns. Power Query can handle both, but you have to configure the transformation correctly for each bank’s layout.
Scanned PDFs. If your bank statement is a scanned image (you cannot select the text), Power Query cannot read it at all. OCR is required before any extraction can happen.
When Power Query is enough
Power Query is a reasonable choice when:
Your statement is a single-page PDF with a clean table
You only need to do this occasionally
You are comfortable using the Power Query Editor to clean up headers and types
When to use a dedicated converter instead
Reach for TallyClip when:
Your statement has multiple pages with repeated headers
Descriptions wrap across lines
You need to process statements from multiple banks with different layouts
You want to avoid manual cleanup in the Power Query Editor
You need OCR for scanned statements
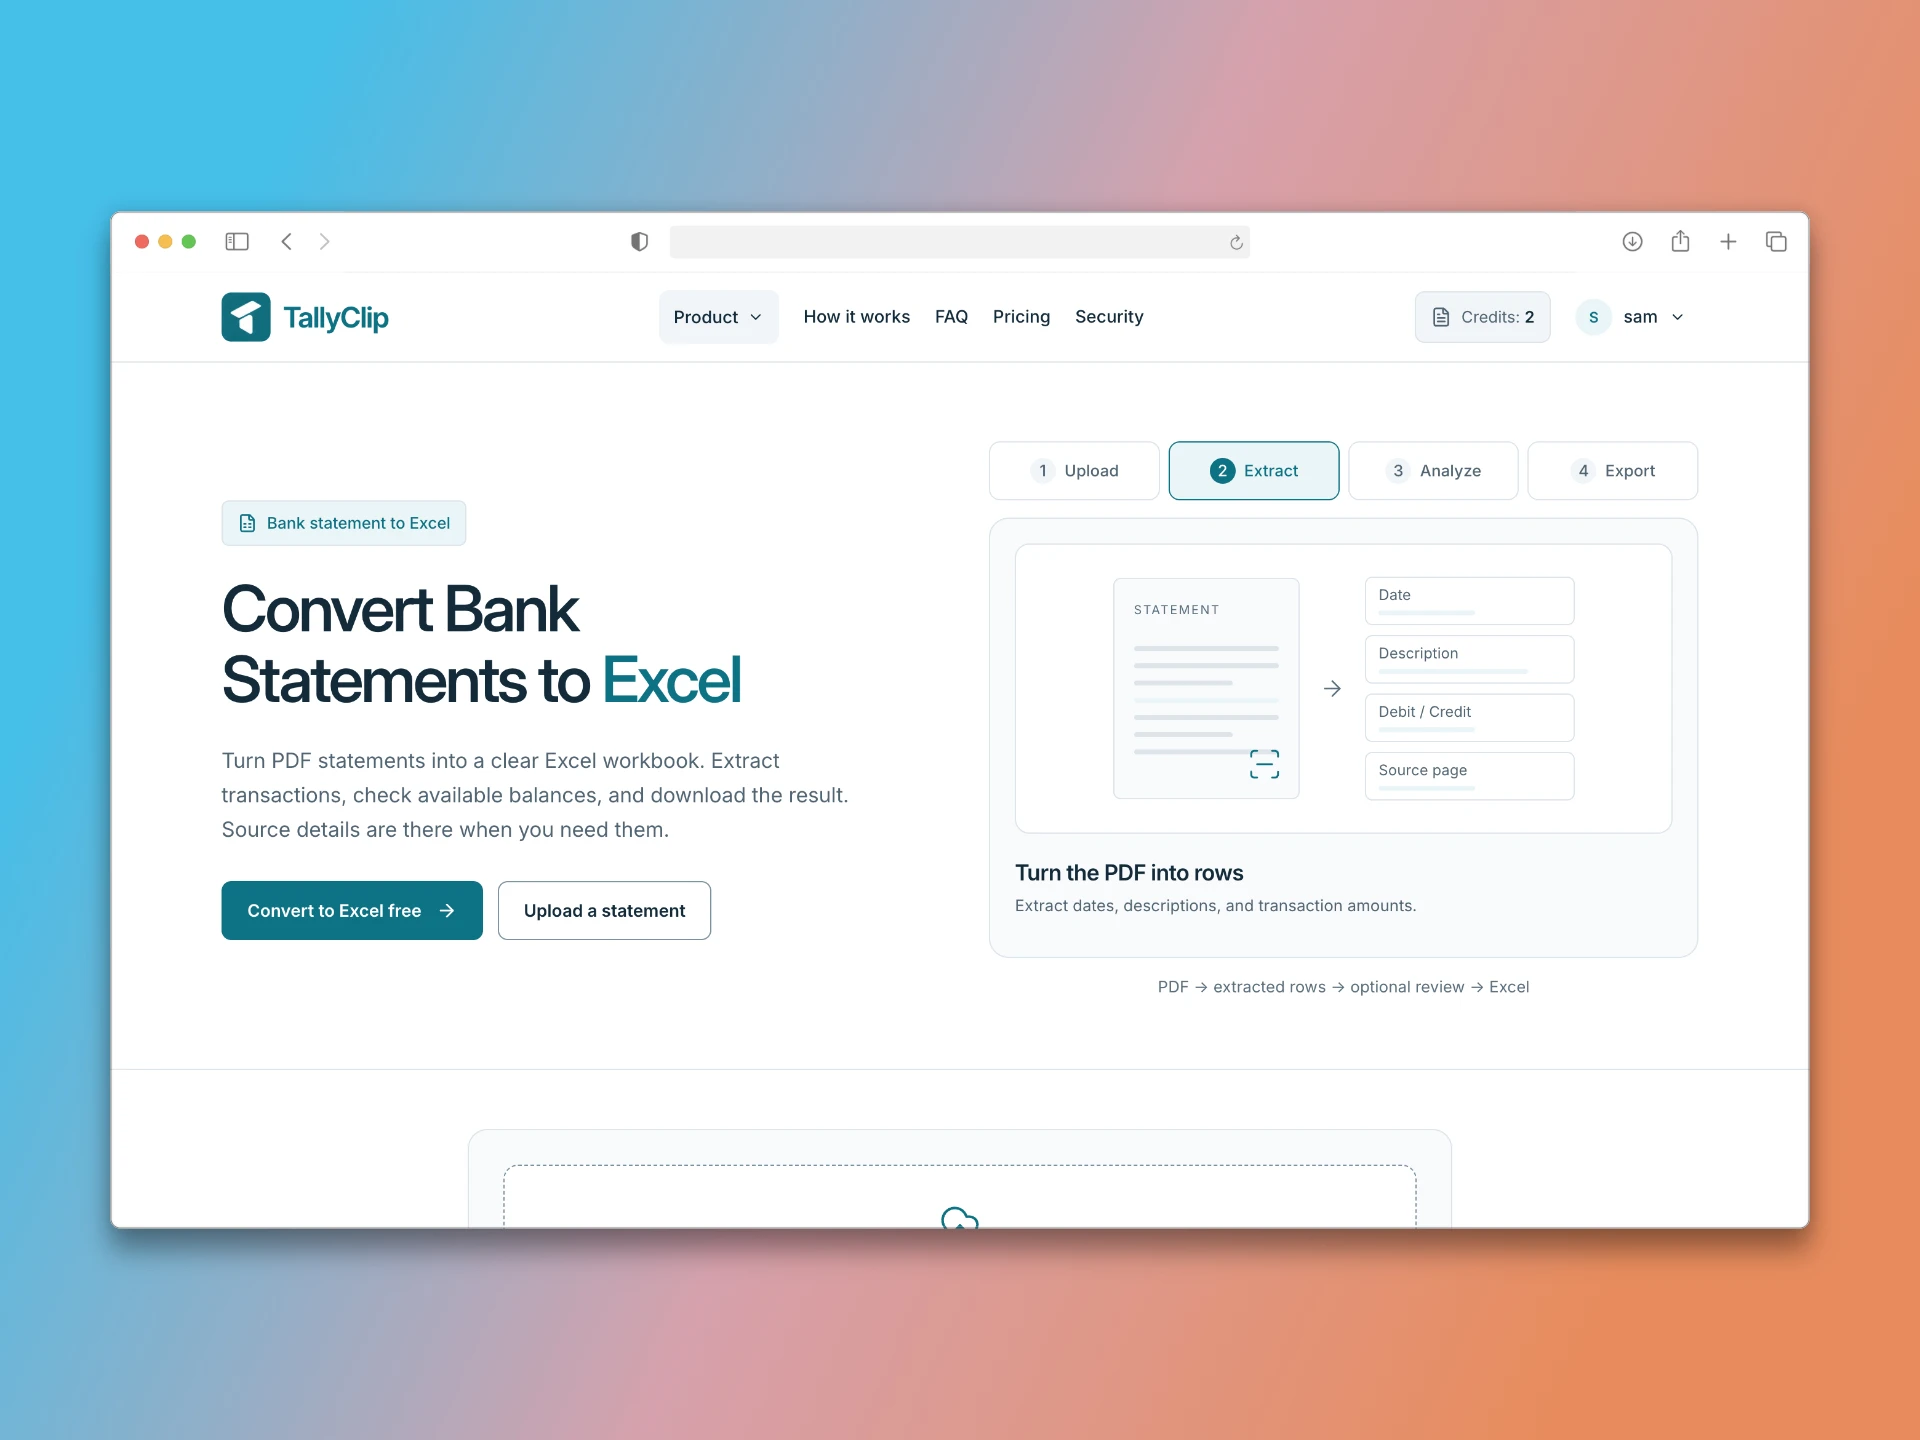
TallyClip handles all of these cases automatically. It identifies the transaction table, strips page headers and footers, groups wrapped descriptions, and outputs a clean table ready for Excel or CSV export.
Key takeaways
Power Query can import tables from clean, machine-generated PDFs.
Expect manual cleanup for repeated headers, wrapped descriptions, and page breaks.
Power Query cannot read scanned PDFs without OCR.
For complex or multi-bank statements, a dedicated converter produces cleaner results with less manual work.